 |
 |
 |
 |
 |
|---|


|
nigroviridis A fish with a compact genome |
||
|
Evolutionary relationships and discrimination between T. nigroviridis and T. fluviatilis at the molecular level Tetraodon species are potential models for various types of molecular studies on compact genomes because of their easy availability. However, earlier taxonomic studies had provided valid and invalid names for the Tetraodon species considered here. An analysis of mitochondrial sequences of Tetraodon nigroviridis and the related species T. fluviatilis and T. biocellatus was therefore undertaken to overcome the recurrent confusions resulting from the difficulties in species definition based on a morphological approach alone. It enabled us to establish correlations between morphological data specified by taxonomists and nucleotide sequence data and to document the phylogenetic relationships between the species that are easily commercially available in various countries. These molecular markers can be readily used as a standard to determine with a high level of confidence the Tetraodon species tested in this study. Tetraodontiformes fishes of the family Tetraodontidae exhibit the lowest DNA content per haploid genome of all Teleost fishes that have been tested to date (Hinegardner and Rosen, 1972). The extreme compactness of the genome in this family, investigated at first in the pufferfish Fugu rubripes (Brenner et al., 1993), and the advantage of being easily obtained and maintained in aquariums make small pufferfishes like some Tetraodon species especially suitable for the purpose of vertebrate genome analysis, as shown from the genes and regions investigated so far (Angrist, 1998; Crnogorac-Jurcevic et al., 1997; Chang et al., 1997; Leu et al., 1998 ; Chou et al., 1998 ; Villard et al., 1998). Nevertheless, even in recent studies on genes and genome analysis, a widespread confusion between these species still prevails (Crnogorac-Jurcevic et al. 1997; Chou et al. 1998; Boeddrich et al. 1999), e.g. morphologists attribute the picture shown in Crnogorac-Jurcevic et al. (1997) to a specimen of T. nigroviridis and not to T. fluviatilis. In other studies, both names T. nigroviridis and T. fluviatilis are used as synonyms for a single species (Chang et al. 1997). This may perpetuate misidentification of the species among scientists. As a prerequisite to more detailed investigations on T. nigroviridis as a new model genome and to clarify this confusing issue, we undertook a molecular characterization of Tetraodon specimens of three related species namely T. nigroviridis, T. fluviatilis and T. biocellatus that were obtained from aquarium fish suppliers as T. fluviatilis (Fig. 1).
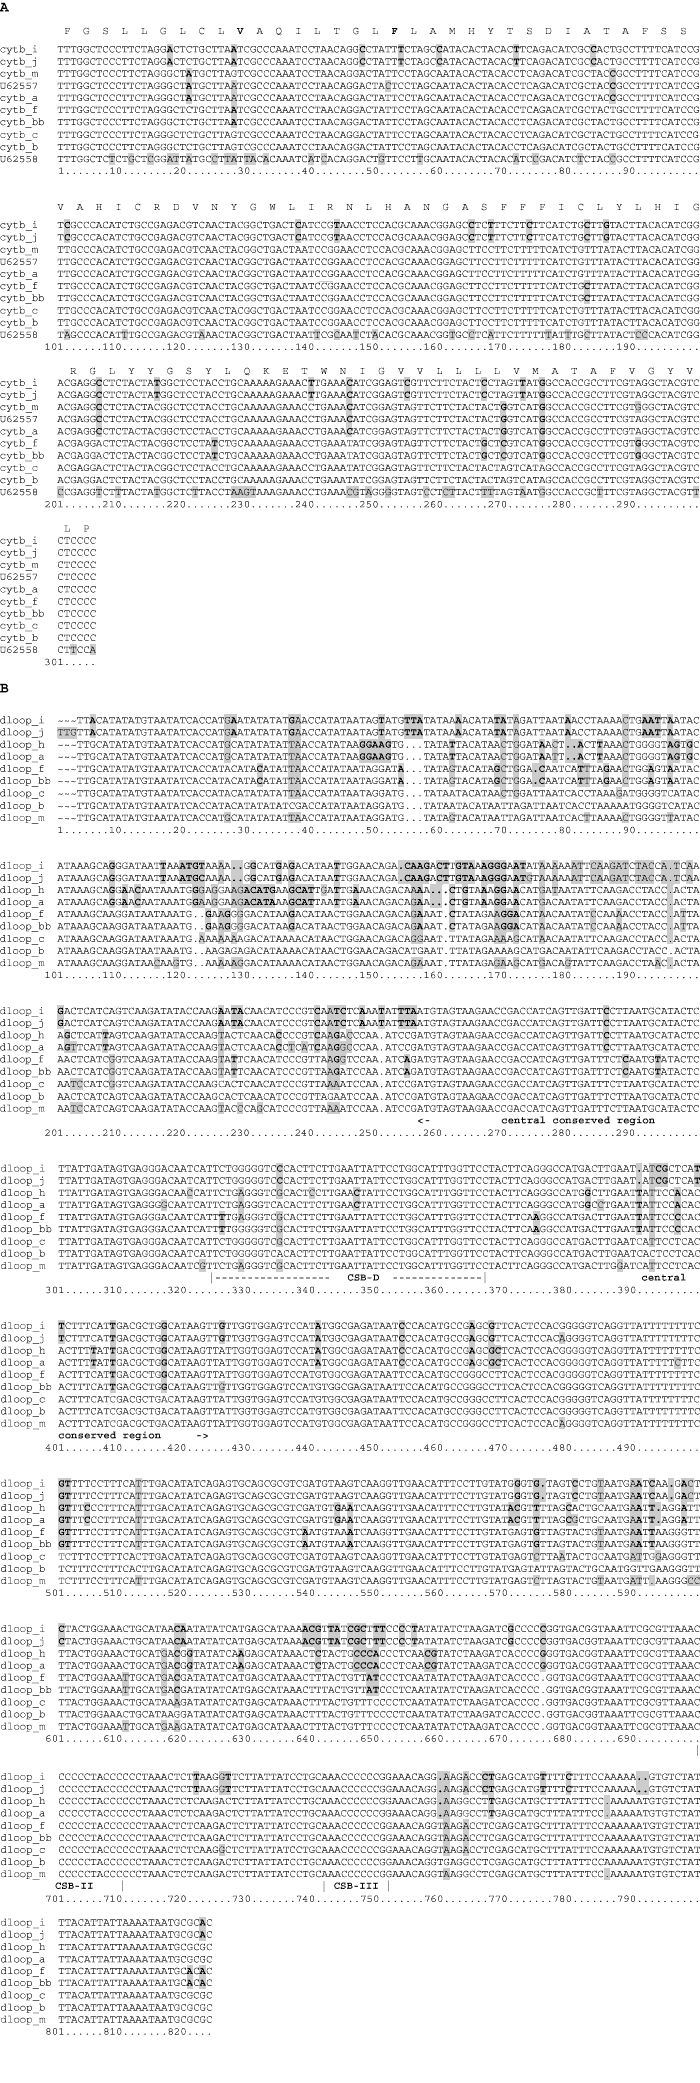
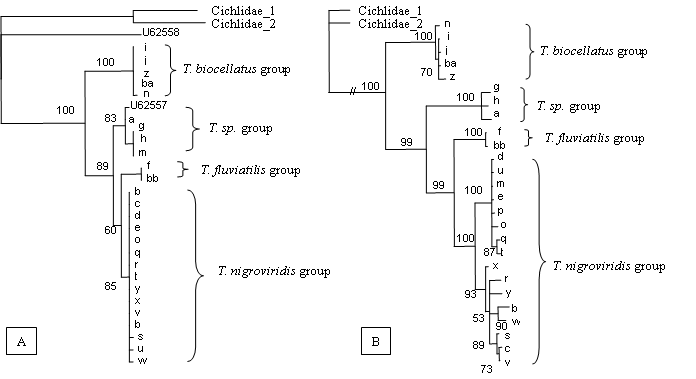
Specimens originating from unknown sources can be subject to a high degree of polymorphism. To discriminate between inter- and intra-species variation, we analyzed the variations of two mitochondrial datasets, the hypervariable control region (D-loop) and part of the cytochrome b (Kocher and Stepien, 1997). Species used in this study were pufferfishes of the family Tetraodontidae (order Tetraodontiformes, class Actinopterygii) : T. nigroviridis (Marion de Procé 1822), T. fluviatilis (Hamilton 1822) and T. biocellatus (Tirant 1885; synonym T. steindachneri Dekkers 1975). Among the 21 specimens tested in this study, 5 presented the T. biocellatus morphotype (specimens i, j, n, z, ba), 4 specimens presented the T. fluviatilis morphotype (specimens f, g, h, bb) and 17 specimens presented the T. nigroviridis morphotype (specimens a, b, c, d, e, m, o, p, q, r, s, t, u, v, w, x, y). Hybrid morphologies were not noticed among this panel. Specimens of different maturity status (as determined from gonad development) were used. The morphotypes T. nigroviridis and T. biocellatus were deposited in the ichtyology collection of the Museum national d'histoire naturelle in Paris under numbers MNHN 1999-0493 and MNHN 1999-0354, respectively. Total genomic DNA used for the amplifications was extracted either from blood, muscle or liver by the phenol/chloroform extraction procedure described in Kocher et al. (1989). Part of cytochrome b and the complete control region were amplified following standard PCR procedures and sequenced on both sides on an ABI 377 automatic sequencer. In order to avoid sequence ambiguities due to PCR misincorporations, at least 2 PCR reactions were conducted independently for each DNA sample. Primers used for amplifications and sequencing were : L14841 (5'-AAAAAGCTTCCATCCAACATCTCAGCATGATGAAA-3') and H15149 (5'-AAACTGCAGCCCCTCAGAATGATATTTGTCCTCA-3') for the cytochrome b gene (Lee et al., 1995 ; Shields and Kocher, 1991); CF17 ( 5'-GTTAGAGTCCTCCCTACTGC-3') and CF18 (5'-ACTTGCATGTGTAAGTTTGG-3') for the control region (this work). The cytochrome b gene amplified region (306 bp) and the complete control region sequences (808-815 bp among the taxa studied) of all specimens tested were subject to sequence variations. To see if the different specimens analyzed could be classified in well defined molecular categories, the sequence data were submitted to phylogenetic analyses. Multiple alignments for phylogenetic analyses (Fig. 2) were done with the programs ED of the MUST package (Philippe, 1993) and PILEUP of the GCG package (Wisconsin Package Version 9.1, Genetics Computer Group (GCG), Madison, Wisc).
They provided 107 variable positions for the cytochrome b dataset (out of 306
positions) among which 70 are informative for parsimony analysis. For the
D-loop dataset, a total of 428 variable positions including 40 indels were
observed out of 863 positions. 390 of these variations are
parsimony-informative. Reconstruction of phylogenetic trees (Fig. 3) by the
method of Maximum Parsimony was done by the PAUP* program (version 4.0;
Swofford 1998) included in the GCG package. The most parsimonious topologies
were found via heuristic search with stepwise addition of taxa and tree
bisection-reconnection (TBR) branch-swapping. Strict consensus trees were
obtained either by the Branch and Bound algorithm or heuristic searches,
depending on the dataset. Bootstrapping (Felsenstein, 1985) was performed with
1000 replications of the initial dataset. Trees were rooted using two Cichlidae
(Perciformes) as outgroup sequences. The Neighbor-Joining method (involving the
PAUP* options or the DNADIST, NEIGHBOR and CONSENSE programs from the PHYLIP
package, Felsenstein 1989) was also used. Both distance-based methods (trees
not shown) or characters-based methods recovered trees with similar topologies.
The level of homoplasy was low, and monophyly of each group was confirmed at
all nodes with high bootstrap proportions (usually > 70 %). Addition or
removal of taxons did not alter significantly the topologies of the trees (data
not shown).
As a consequence, the monophyletic clustering of Tetraodon species is confirmed (Fig. 3). Assignment of T. biocellatus specimens (i, j, n, z, ba) to a sister clade of T. fluviatilis and T. nigroviridis was supported by high bootstrap proportions for both datasets. Partition of remaining specimens into three groups was clearly supported by cytochrome b and control region sequence analysis (Figures 2 and 3). Groupings of the sequences are in agrement with specimen morphology, except for specimens quoted as T. sp. : specimens a (T. Crnogorac-Jurcevic, I. C. R. F., London, personal communication) and m presented the T. nigroviridis morphotype whereas specimens g and h presented the T. fluviatilis morphotype. Therefore, it appears that discrimination of T. fluviatilis/T. nigroviridis on the basis of simple morphological characters such as body color and pattern alone is not sufficient. However, molecular markers such as the cytochrome b and control region sequences help in grouping the specimens into a defined species group. Diagnostic characters for each species with reference to the T. nigroviridis haplotype are provided in the alignments (Fig. 2). In the T. nigroviridis group itself, two major lineages can be distinguished, which could be related to intraspecific structuration such as a possible geographical distribution-associated pattern. In the case of commercial specimens, it is not possible to provide a precise answer to this question. More intriguing is the occurrence of a distinct mitochondrial haplotype in the panel of specimens studied (quoted as T. sp. group), which lumps together specimens of T. nigroviridis and T. fluviatilis morphotypes. Although no indication of origin and/or breeding conditions are available for these specimens, two main hypotheses can be suggested that may account for the grouping of these haplotypes : 1) heteroplasmy resulting from introgressive hybridization or ancestral polymorphism; 2) the existence of another cryptic species that can be identified by sequence but not morphologically. However, the "composite group" is made of individualized rather than intermediate morphotypes. Fishes with different morphologies and coloration patterns being grouped together makes the second hypothesis unlikely. Probable hybridization processes are not very surprising, since genetic crosses in fish lineages are reported to happen frequently (Campton 1987). Different species of Tetraodon are cohabiting in the wild or in hatcheries, enabling possible hybridization processes to occur. Hybridization is even favoured when species are not in their natural environment. Persistant ancestral polymorphism would have the same effect on tree topology (Doyle 1992, 1997; Maddison 1997). Moreover, specimen m (T. nigroviridis morphotype) is clearly grouped with other T. sp. haplotypes on the basis of cytochrome b sequences analysis, but with T. nigroviridis haplotypes on the basis of D-loop sequences analysis (Figure 3). These results show that a "process of discord" (Maddison, 1997) must have occured in the past, consistent with the first hypothesis. As a consequence, these morphologically atypical specimens are highlighting the necessity of a molecular assessment of the identity of a particular specimen. Since T. nigroviridis and T. fluviatilis appear to be very closely related, a careful choice of the species used should not be based on morphology alone. Different species groups can be distinguished on the basis of DNA sequence analysis and the mitochondrial sequence data presented here may now serve as a standard for further experiments conducted on the pufferfish T. nigroviridis in other laboratories. References Angrist, M. (1998). Less is more: compact genomes pay dividents. Genome Res. 8: 683-685. Boeddrich, A., Burgtorf, C., Roest Crollius, H., Hennig, S., Bernot, A., Clark, M., Reinhardt, R., Lehrach, H. and Francis, F. (1999). Analysis of the spermine synthase gene region in Fugu rubripes, Tetraodon fluviatilis, and Danio rerio. Genomics 57:164-168. Brenner, S., G. Elgar, R. Sandford, A. Macrae, B. Venkatesh, S. Apariciao. (1993). Characterization of the pufferfish (Fugu) genome as a compact model vertebrate genome. Nature 366: 567-571. Campton, D. E. (1987). Natural hybridization and introgresison in fishes: Methods of detection and genetic interpretations. In " Population genetics and fisheries management " (N. Ryman and F. M. Utter, Eds.), pp. 161-192, CRC Press, Boca Raton, Florida. Chang, M. S., Leu, J. H., Yao, C. W., Huang, F. L., and Huang, C. J. (1997). Genomic structure and promoter region of c-fos gene of round-spotted pufferfish, Tetraodon nigroviridis (syn. T. fluviatilis). Zool. Studies 36: 159-169. Chou C. M., Lin W. C., Leu J.H., Su T.L., Chou C. K., Huang C. J. (1998). Isolation and identification of novel protein kinase genes from the round-spotted pufferfish (Tetraodon fluviatilis) genomic DNA. J Biomed. Sci. 5:127-134. Crnogorac-Jurcevic, T., Brown, J. R., Lehrach, H. and Schalkwyk, L. C. (1997). Tetraodon fluviatilis, a new pufferfish model for genome studies. Genomics 41: 177-184. Dekkers, W. J. (1975). Review of the asiatic freshwater puffers of the genus Tetraodon Linnaeus, 1758 (pisces, tetraodontiformes, tetraodontidae). Bijdragen tot de Dierkunde 45: 88-142. Doyle, J. J. (1992). Gene trees and species trees : molecular systematics as one-character taxonomy. Syst. Bot. 17: 144-163. Doyle, J. J. (1997). Trees within trees : genes and species, molecules and morphology. Syst. Biol. 46: 537-553. Eschmeyer, W.N. (1998). Catalog of fishes. (Eschmeyer, W.N., Ed.), Special Publication, California Academy of Sciences, San Francisco. 3 vols. 2905 p. FishBase (1998). FishBase 98 CD-ROM. ICLARM, Manila. Felsenstein, J. (1985). Confidence limits on phylogenies : an approach using the bootstrap. Evolution 39: 783-791 Hinegardner, R., and Rosen, D. E. (1972). Cellular DNA content and the evolution of teleostean fishes. Am. Naturalist 196: 621-644. Kocher, T. D. and Stepien, C. A. (1997). Molecular systematics of fishes. Academic Press, San Diego Kocher, T. D., Thomas, W. K., Meyer, A., Edwards, S. V., Pääbo S., Villabklanca, F. X. and Wilson, A. C. (1989). Dynamics of mitochondrial DNA evolution in animals : amplification and sequencing with conserved primers. Proc. Natl. Acad. Sci. USA 86: 6196-6200. Lee, W.-J., Conroy, J., Huntting Howell, W. and Kocher, T. D. (1995). Structure and evolution of Teleost mitochondrial control regions. J. Mol. Evol. 41: 54-66. Leu, J. H., Chang, M. S., Yao, C. W., Chou, C. K., Chen S. T. and Huang, C. J. (1998). Genomic organization and characterization of the promoter region of the round-spotted pufferfish (Tetraodon fluviatilis) JAK1 kinase gene. Biochim. Biophys. Acta 1395: 50-56. Maddison, W. P. (1997). Gene trees in species trees. Syst. Biol. 46: 523-536. Philippe H. (1993). MUST, a computer package of Management Utilities for Sequences and Trees. Nucl. Ac. Res. 21: 5264-5272. Saccone, C., Pesole, G. and Sbisa, E. (1991). The main regulatory region of mammalian mitochondrial DNA : structure-function model and evolutionary pattern. J. Mol. Evol. 33: 83-91. Shields, G. F. and Kocher, T. D. (1991). Phylogenetic relationships of North American Ursids based on analysis of mitochondrial DNA. Evolution 45: 218-221. Swofford, D. L. (1998). PAUP* 4.0 : Phylogenetic analysis using parsimony (and other methods). Sinauer Associates, Inc., Sunderland, MA. Villard, L. F., Tassone, F., Crnogorac-Jurcevic, T., Clancy, K. and Gardiner, K. (1998). Analysis of pufferfish homologues of the AT-rich human APP gene. Gene 27: 17-24 |


 home |
overview |
resources |
sequencing |
news |
press releases |
site |
Legal information
webmaster@genoscope.cns.fr

